Overview: Monitoring Center (Migrated Cloud Servers and VPS)
Valid for migrated Cloud Servers and VPS, which are managed in the Cloud Panel
In this article, you will learn how the Monitoring Center in the Cloud Panel is structured, and what information it provides on the availability of your migrated Cloud Servers or VPS.
General information on monitoring
Regular monitoring of your servers is generally recommended. This allows you to recognise performance bottlenecks and any problems that may occur at an early stage, and be informed punctually if the server or individual components fail. This also applies to certain types of cyber attacks. If you are attacked, a quick response is essential to stop the attack and minimise the damage caused.
Comprehensive information on analysing performance bottlenecks can be found in the following articles:
Open Monitoring Center
To open the Monitoring Center, complete the following:
- Log in to your IONOS account.
In the title bar, click on Menu > Servers & Cloud.
Optional: Select the desired Servers & Cloud contract. The Cloud Panel opens and the Infrastructure > Server area is displayed.
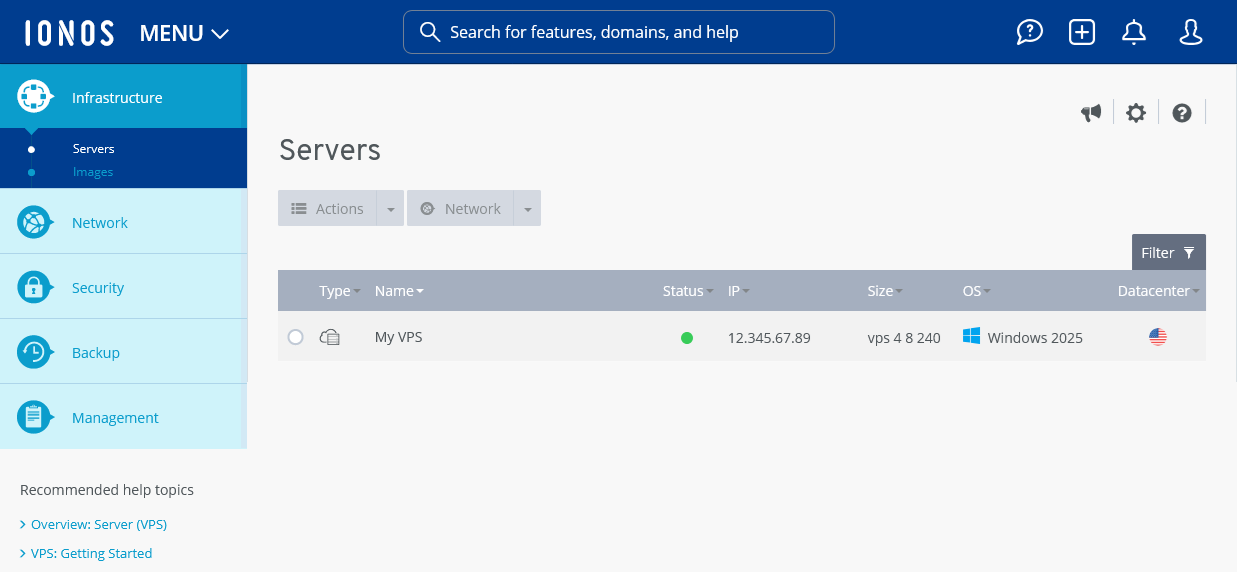
- Click Security > Monitoring Center in the navigation bar on the left. The Monitoring Center opens.
Structure of the Monitoring Center
All the servers you have configured are listed in a table in the Monitoring Center. The following information is listed in this table:
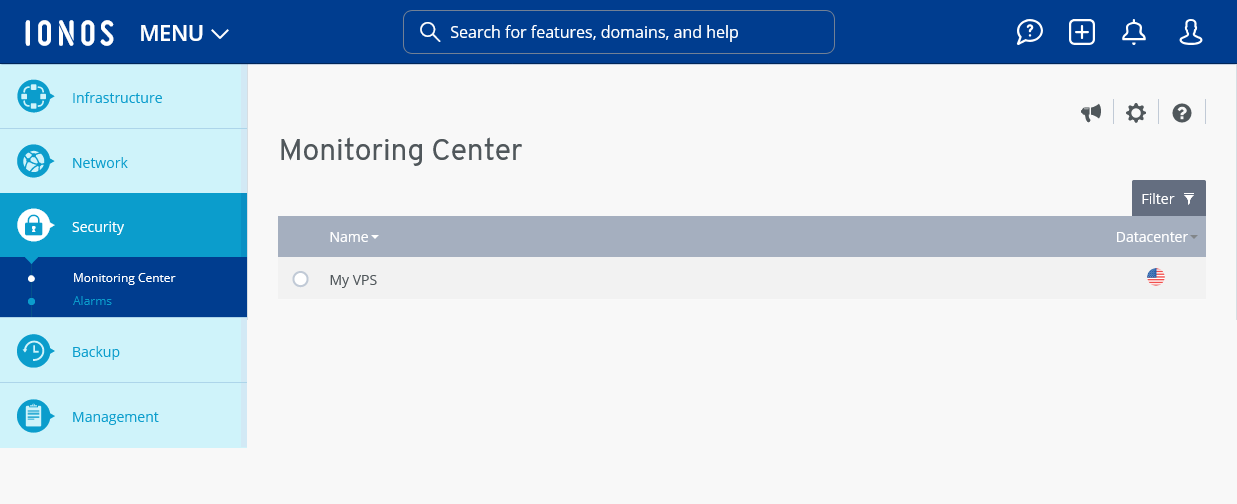
Name: Name of the monitored server.
Data center: Data centre in which the server is located.
To display graphical analyses of the monitoring, select the desired server. Then select the desired time period in the Period section and click on Apply.
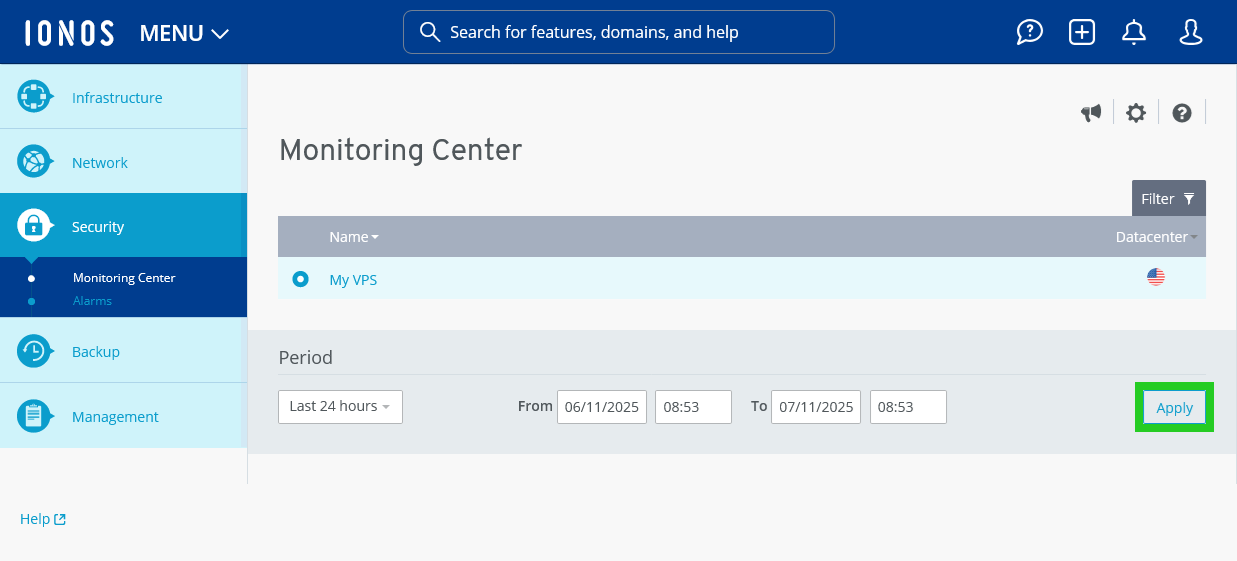
The following graphical analyses are then displayed:
- CPU load average
- Network: Bytes/second received
- Network: Bytes/second sent
- Network: Packets/second received
- Network: Packets/second sent
- Storage: Bytes/second read
- Storage: Bytes/second written
- Storage: IOPs read
- Storage: IOPs write