Monitoring server performance (Windows Server 2025)
Valid for Cloud Servers, migrated Cloud Servers, VPS, Dedicated Servers, and Server Power Deals with the Windows Server 2025 operating system.
This article explains the types of performance problems that can occur. You will also learn which applications you can use to monitor your server in order to identify performance problems and eliminate the causes.
Note
Regular monitoring of the server is generally recommended in order to identify performance bottlenecks and any problems that may occur at an early stage, and to prevent a failure of the server, individual components, or applications in good time. This also applies to certain types of cyber attacks. If you are attacked, a quick response is essential to stop the attack and minimise the damage caused.
A list of events that Microsoft recommends monitoring can be found in the following article from Microsoft:
https://learn.microsoft.com/en-gb/windows-server/identity/ad-ds/plan/appendix-l--events-to-monitor?redirectedfrom=MSDN
Types of performance problems
The causes of performance problems can be very diverse. For this reason, it is very important that these are precisely located. The following types of performance problems can occur under certain circumstances:
Low access speed of the SSD/hard drive:
This problem can occur with dedicated servers.
If the server takes a long time to start the operating system or programs, and/or to log in, the SSD/hard drive access speed may be too slow.
This problem can also occur if the operating system or programs use the swap file, or data has to be loaded or saved.
High system or CPU load:
A constantly high CPU utilisation rate is an indicator that the server's processor is overloaded.
- If the system or CPU load is too high, there will be delays in the execution of applications and user interactions.
If the server has too little RAM, this can lead to the processor being permanently overloaded. A permanently increased processor utilisation can also be a sign of malware.
Low data throughput of the network interfaces:
A low data throughput of the network interfaces leads to a general delay in the display and response times.
A wide variety of problems can occur if the network interfaces are over-utilised.
The performance problems range from high latencies to error messages when opening websites.
Tips for analysing
- To determine the cause of performance problems, it is important to distinguish whether they are temporary or permanent.
- If the performance problems are temporary, check whether a pattern is recognisable. To do this, analyse the processes and regular tasks carried out by your server.
- If necessary, reschedule regularly performed tasks and then check whether the performance problems still occur after this change.
- If necessary, check whether the performance problems always occur when a certain action is executed. This could be, for example, a very slow page load or a very slow upload or download.
- Check which updates have been installed on the server and find out whether a new update that affects the performance of your server needs to be installed.
- If a process is unknown to you or you are not sure whether it is malware, you should research the process name on the Internet. Pay particular attention to processes that require an unusually large amount of resources.
Please Note
We recommend that you install security patches and updates for the operating system and the installed programs regularly and in good time, and test them beforehand to check possible effects on your specific environment. Also, ensure that security patches and updates for the plug-ins you use are installed promptly.
Applications for analysing and monitoring performance problems
You can monitor the performance of your server using the following programs in Microsoft Windows Server 2025:
- Task Manager
- Resource Monitor
- Windows Performance Monitor
- Reliability Monitor
- Event Viewer
- DTrace
Use Task Manager for an initial analysis of the current system utilisation
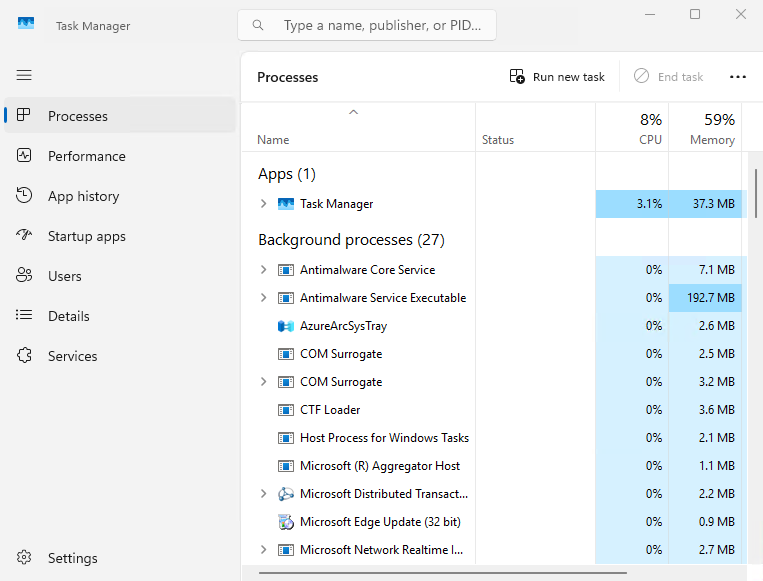
The Task Manager displays current information on the programs and processes running, and the system load by default. You can use this to get an overview of the current performance of your server.
To open the Task Manager, proceed as follows:
- Right-click on the taskbar.
- Click on Task Manager.
- In the navigation bar on the left, click on the button with the three horizontal lines (Open navigation tooltip).
The following information is listed in the Task Manager:
Processes area: This area lists all currently running programs and processes. You can terminate running programs and processes in this area.
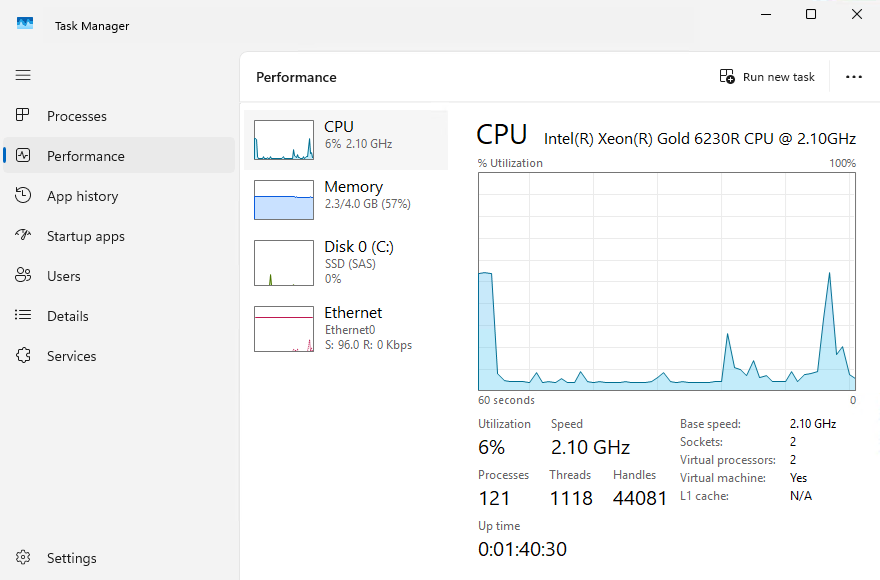
Performance area: This area displays information on the current CPU utilisation, the memory currently in use, and the current network utilisation. This information is displayed in graphical form.
App history area: This area provides an overview and a history of resource utilisation by the applications in the current user account.
Startup apps area: All automatically started applications are displayed in the Startup apps area. To deactivate the autostart of an app, right-click on the desired app and select Disable.
Users area: This area lists the logged-in users and the programs and processes that are currently running in this user profile.
Details area: This area lists all processes. The list includes the names of the processes, the status, the CPU and memory utilisation.
Services area: This area displays information on the system services currently running.
Use Resource Monitor for performance monitoring
The Resource Monitor provides you with a detailed view of the current utilisation of CPU, disk, and memory resources, as well as the server's network activity. These are displayed in real time. In addition, the resource overview contains four animated diagrams that show the utilisation of the resources.
To open the resource monitor, proceed as follows:
- Right-click on the Start icon in the taskbar.
- Click on Run.
- Then enter the command resmon in the Run window and click OK.
The following tabs are listed in the Resource Monitor:
Overview: The Overview tab contains a summary of the most important information on resource utilisation.

CPU: The CPU area displays the processor utilisation in detail.
Disk: The Disk area shows which processes perform write and read accesses to disks, and how much data a process writes and reads.
Network: The Network area shows which processes are sending and receiving data.
Memory: All processes and their memory consumption are listed in the Memory area.
Note
To end individual processes, right-click on the desired process. Then click on End process.
Use Windows Performance Monitor for further analysis
With Windows Performance Monitor, you can collect detailed performance information on resource utilisation and running processes. You can create data collection sets to configure and plan the performance indicators.
To open Windows Performance Monitor, complete the following:
- Right-click on the Start icon in the taskbar.
- Click on Run.
- Then enter the command perfmon.msc in the Run window and click OK.
Further information on Windows performance monitoring can be found here:
Reliability Monitor
Reliability Monitor allows you to display the stability index for evaluating the overall system stability within a specific time period. If you select a specific time period, you can also check any hardware and software problems that have affected or are affecting the system.
To open the Reliability Monitor, proceed as follows:
- Right-click on the Start icon in the taskbar.
- Click on Run.
- Then enter the command perfmon /rel in the Run window and click OK.
Analysing warnings and errors with the Event Viewer
Information, warnings, and errors relating to the hardware or operating system are displayed in the Microsoft Windows event log. If, for example, the start of an application fails, this is listed in the event log.
To open the Event Viewer, complete the following:
- Right-click on the Start icon in the taskbar.
- Click on Run.
- Then enter the command eventvwr in the Run window and click OK.
Using DTrace to analyse performance
DTrace is a command line program that allows you to monitor and debug the system performance of your server in real time. This tool was originally developed for the Solaris operating system, and is available for Windows Server 2025. With DTrace, you can dynamically instrument the kernel and user space code without requiring any changes to the source code. In addition, you can use this tool to define probes to be monitored in order to record kernel or application-defined events. This is done by using scripts that are created using the D programming language. the D language is similar to C, and offers powerful options for filtering and summarising data in the kernel before it is forwarded to the user area. You can retrieve the events in real time, or from a log file, and use them to troubleshoot or identify performance issues in an application.
Activate DTrace
To use DTrace, you must first enable the program. To do this, open the command prompt or PowerShell as an administrator and execute the following command:
bcdedit /set dtrace on
Please Note
After activating DTrace, the server must be restarted.
First steps with DTrace on your IONOS Server
Using DTrace on Windows Server 2025 is straightforward. The tool is already part of the operating system and can be opened directly in Powershell or in the command prompt.
List available probes: To list the available probes, enter the following command:
dtrace -l
To get a quick overview of the most frequent system calls on your server, enter the following command:
dtrace -n "syscall:::entry { @[probefunc] = count(); }"
Further information
Parameters
Information on the parameters can be found in the following article from Microsoft Learn:
DTrace programming with D
Further information on programming with D can be found in the following article from Microsoft:
Code examples
You can find code examples in the following article: