Overview: Monitoring Policies
For Cloud Servers, Virtual Server Cloud, Dedicated Servers and Server Power Deals managed in the Cloud Panel
You can use a monitoring policy in the Cloud Panel to track your server's performance and create rules for which events you want to be notified. These Cloud Panel notifications are displayed in the Servers section of the Server List view under the Warnings column. Additionally, you can have the notification sent to an email address of your choice.
Opening the Monitoring Policies Section
- Log in to your IONOS account.
Click Menu > Server & Cloud in the title bar. If you have multiple contracts, select the desired Server & Cloud contract.
To open the Monitoring Policies pane, click Security > Monitoring Policies in the left navigation bar of the Cloud Panel.
Structure of the Monitoring Policies Section
In the Security > Monitoring Policies section of the Cloud Panel, all of the monitoring policies you have configured are listed in a table. This table lists the most important information about each monitoring policy:
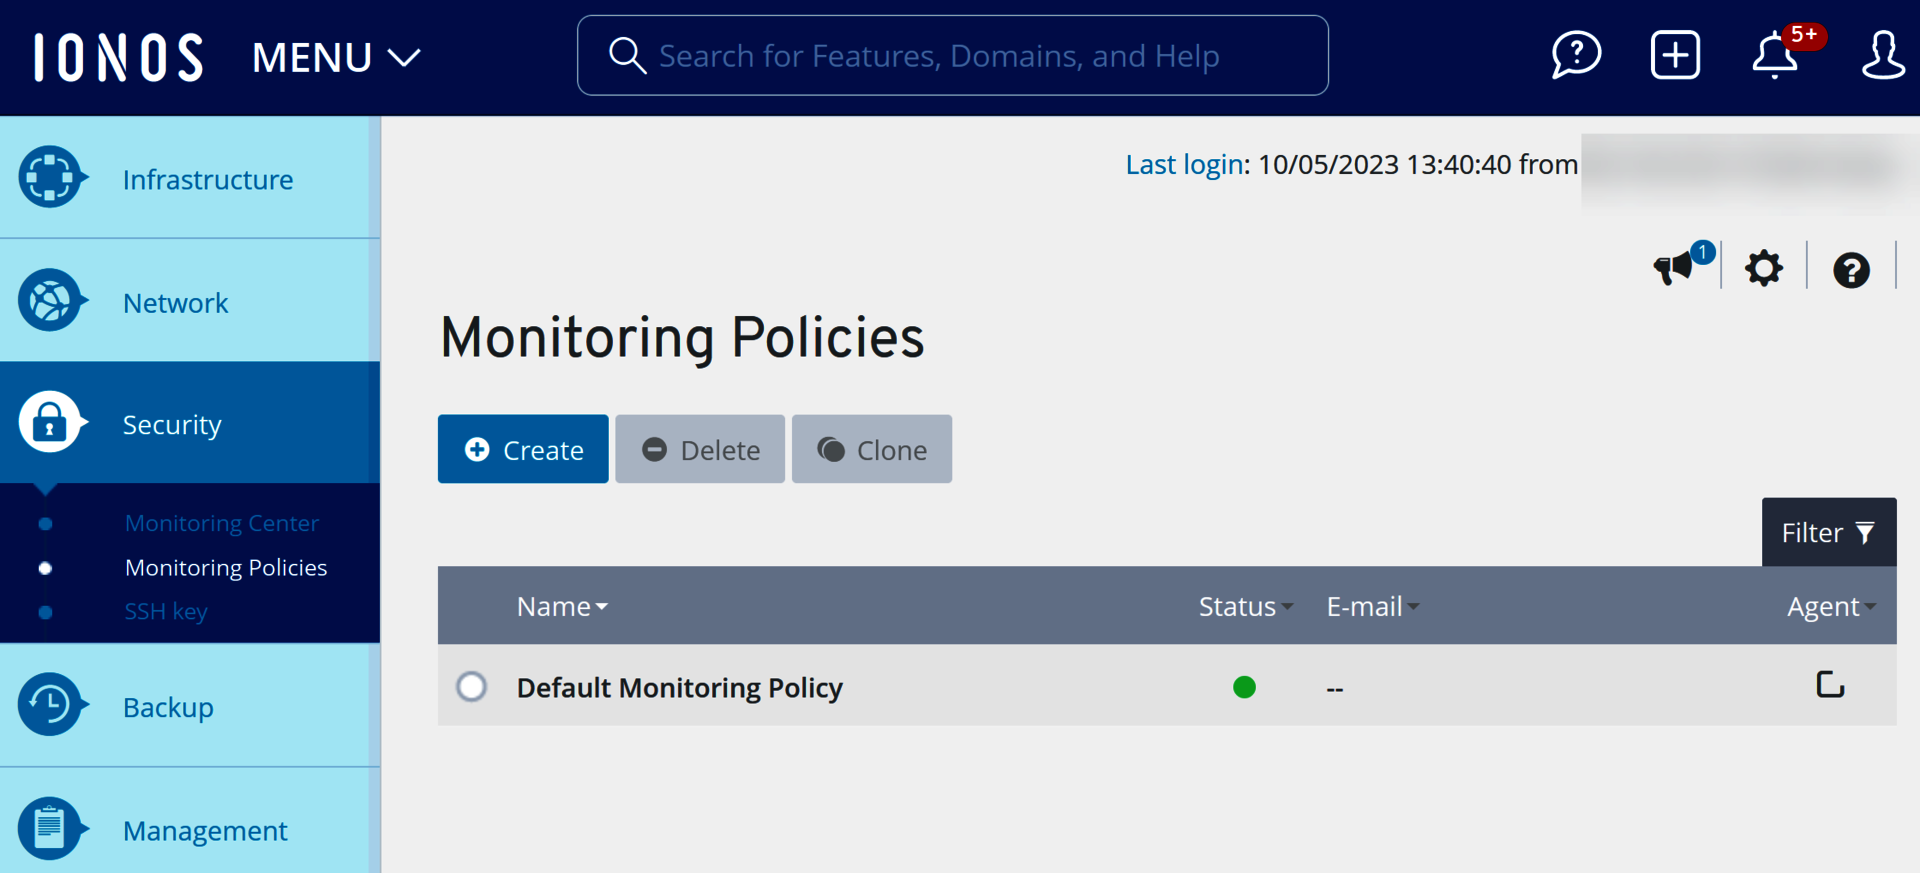
Name: Name assigned to the monitoring policy. You can change the name at any time.
Status: Current status of the monitoring policy.
Email: Email address to which all alerts of the monitoring policy should be sent.
Agent: Monitoring type of the monitoring policy.
Monitoring with Agent: If the monitoring type With Agent was selected when the monitoring policy was created, the
 icon is displayed. With a monitoring policy of this type, you can monitor the CPU, RAM, network, and ping resources, as well as the free memory on the SSD/HDD and running processes. To retrieve information about free memory on the SSD/HDD and running processes, you must install the Monitoring Agent on the servers you want to monitor. For more information about installing the Monitoring Agent, see the following article:
Important information about installing the Monitoring AgentMonitoring without agent: If the monitoring type Without agent was selected when the monitoring policy was created, the
 icon is displayed. This monitoring policy can be used to monitor CPU, RAM, network, and ping resources only. It cannot be used to monitor dedicated servers.
To access all the information about the desired monitoring policy, click the monitoring policy name. The list contains the following additional information:
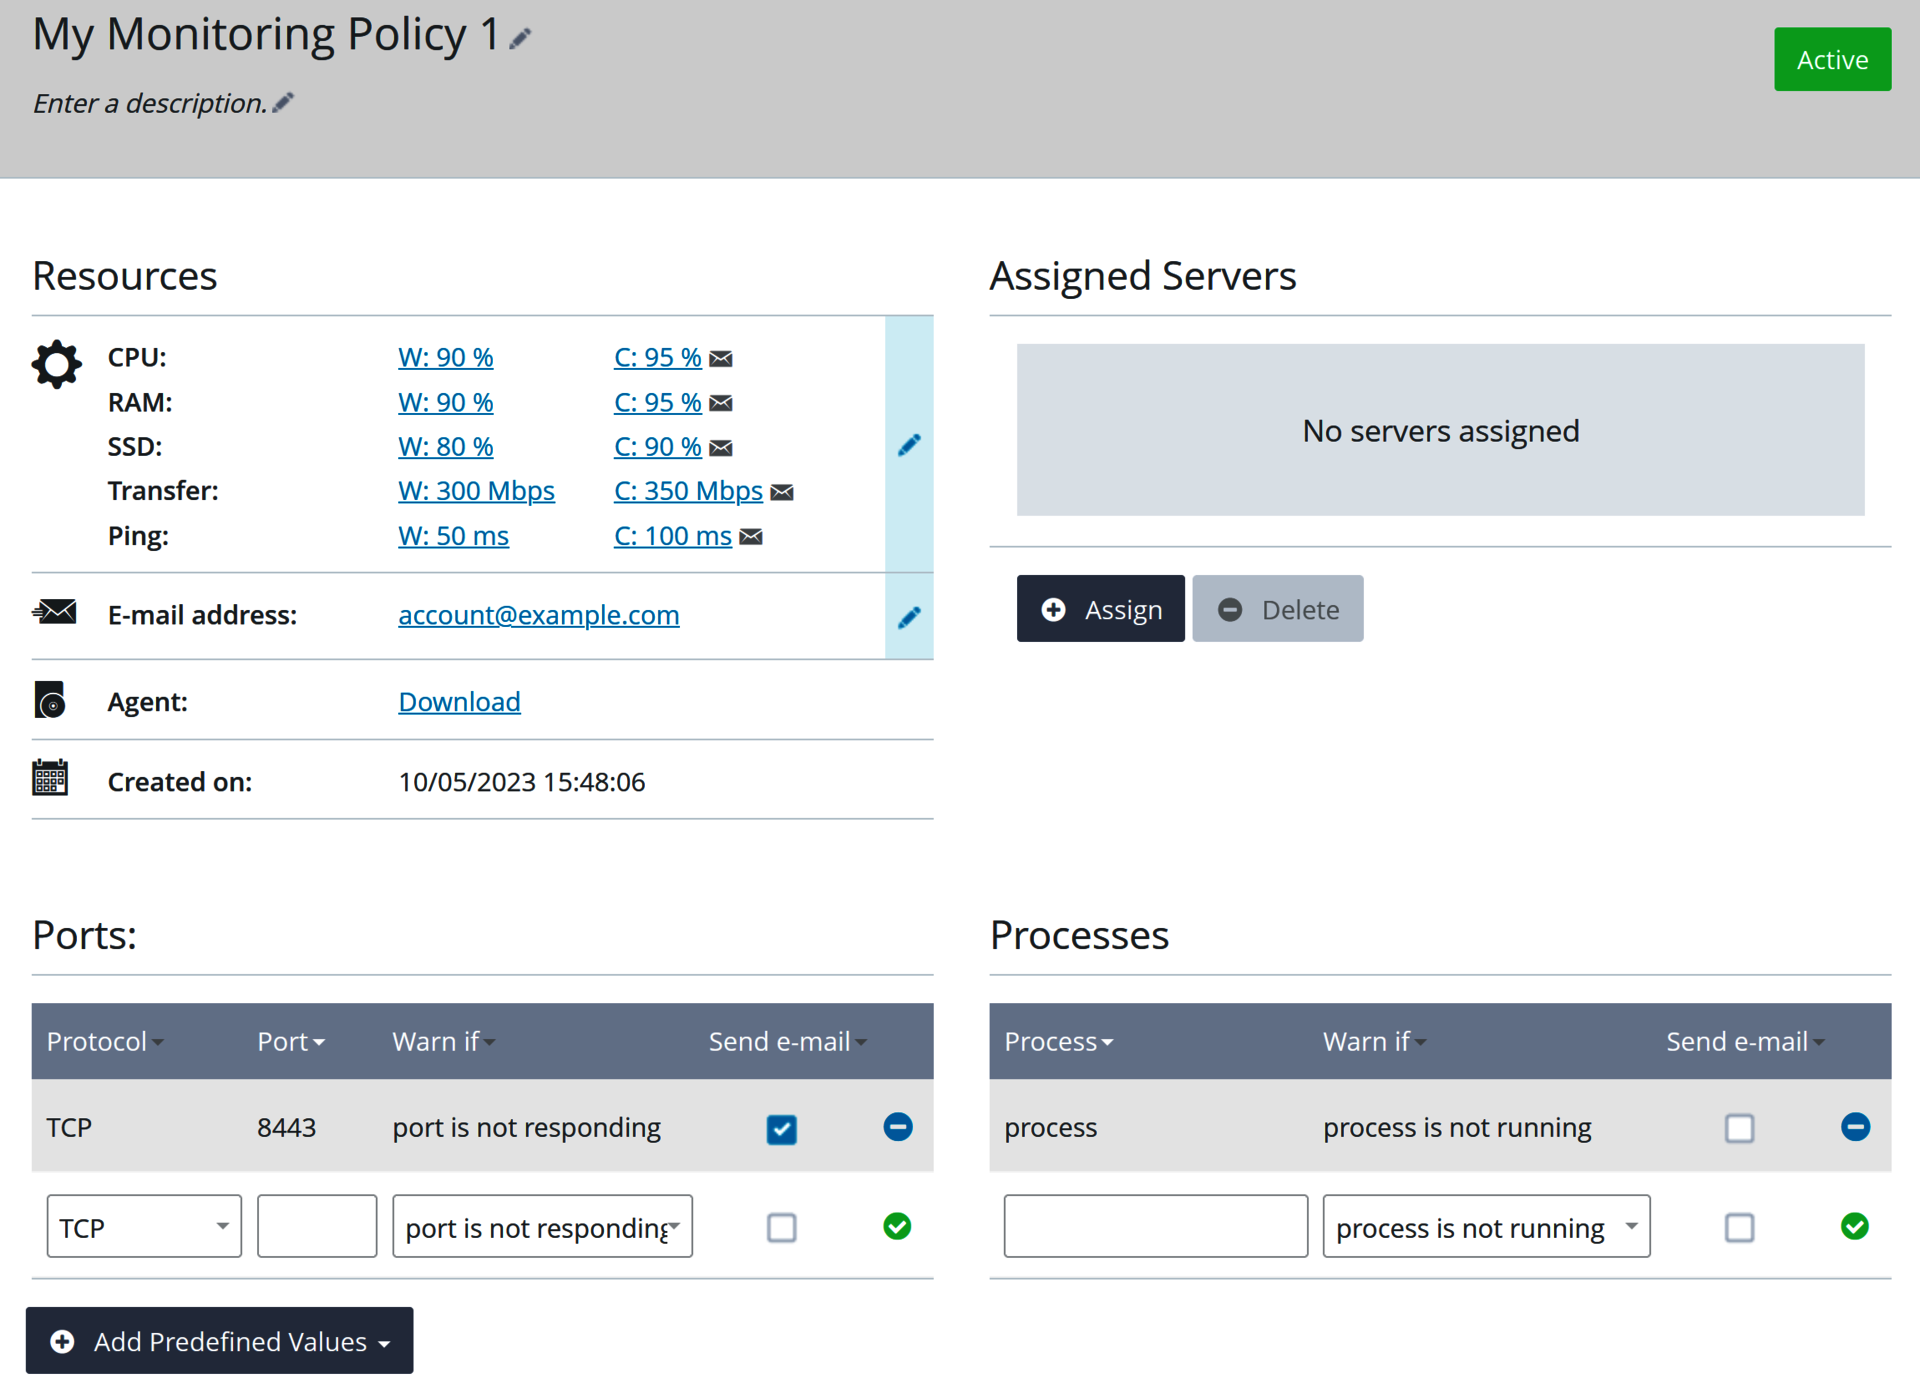
Description: Description of the monitoring policy. You can change the description at any time.
Resources: Resources monitored by the monitoring policy. The displayed information is updated by the monitoring policy at a time interval of 5 minutes. You can change the set thresholds at any time. This section also lists the email address to which alerts are automatically sent. You can change the email address at any time.
Ports: Ports that are monitored by the monitoring policy. You can remove ports or add more ports at any time.
Notes
To add a port, click check mark icon.
To remove a port, click minus icon.
Processes: Processes that are monitored by the monitoring policy. You can remove processes or add more processes at any time.
Assigned servers: These are the servers that are monitored by the monitoring policy.
Notes
To use this monitoring type, you must install the agent on the server you want to monitor.
If you monitor a server without having an agent installed, no information about free disk space or running processes can be retrieved.
Creation date: Date when the monitoring policy was set up.
To edit an item, click the pencil icon.