How to create a Gantt chart in Google Sheets
A Gantt chart is a special type of bar chart, in which each individual bar is arranged along a timeline to visualise when tasks should begin and how long they should last for. Project managers tend to use these types of bar charts named after mechanical engineer Henry Gantt to organise processes and steps in a project. Using a Gantt chart, the project manager gains a full overview of all outstanding tasks: who’s responsible for which assignment, when individual duties should begin, and the time frame project members have been assigned to finish their work.
Spreadsheet programs such as Microsoft Excel or Google Sheets allow users to create their own Gantt charts in just a few simple steps. The special advantage of Google Gantt charts is that they are accessible anywhere and can be shared among project teams with ease. Part of the Google Workspace by Google, Sheets is a cloud-based tool accessible by multiple team members at the same time to modify in real-time.
When you and your team are collaborating on a project, it makes sense to utilise collaborative tools to keep members up to date on current processes. In the following, we’ll explain how you can create your own Gantt charts with Google Sheets step by step.
Creating Google Gantt charts step by step
Using Google Docs to create Gantt charts is achievable in just a few simple steps. Here’s how to do it.
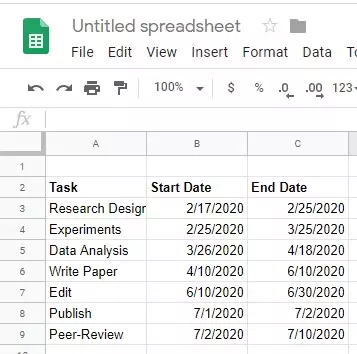
1. Create a new project spreadsheet which should include a column that explains the task (“Task”) and one column containing the “Start Date” and another the “End Date.” To assign responsibilities you could add a fourth column with a name of the person responsible for a certain task.
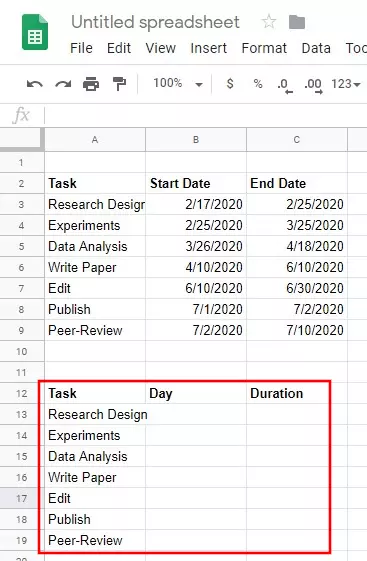
2. Copy the header of the project table and insert it where you want to insert the Gantt chart later. The header should now include a column entitled “Duration” instead of “End Date” and we’re using “Day” instead of the “Start Date.” Now, copy the descriptions of the individual tasks.
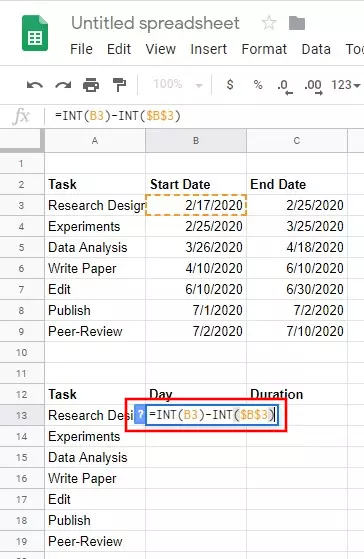
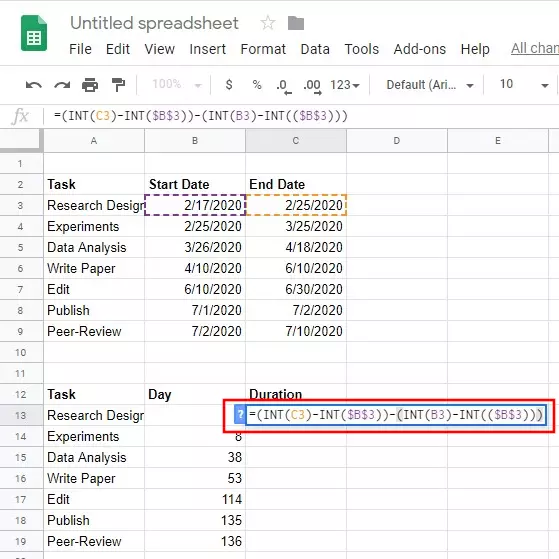
3. Within the “Day” column of your copied table, enter the formula to calculate the days between tasks, i.e. the difference between a task and the very first task. In the example below, the formula would be “=int(B3)-int($B$3)”. The start date of the first task is contained in cell B3 in the example below. However, this may differ depending on the arrangement in your spreadsheet.
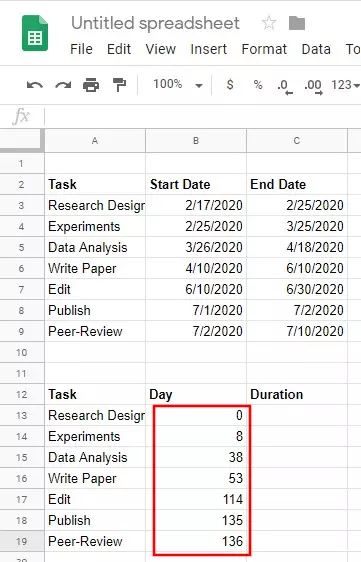
4. Click on the small blue square in the bottom right corner of the cell used to calculate the difference between the start date of a task and the very first task and pull it down across all other cells up to the final cell containing a task. Doing so will copy the formula across all other cells automatically. Google Sheets then auto-calculates the values across the individual cells.
5. Below the cell containing the Duration header, enter the formula to calculate how much time should be spent performing each task. The formula subtracts the value of the start date of the very first task from the end date of each individual task. The formula in this example would be: “=(int(C3)-int($B$3))-(int(B3)-int$B$3”.
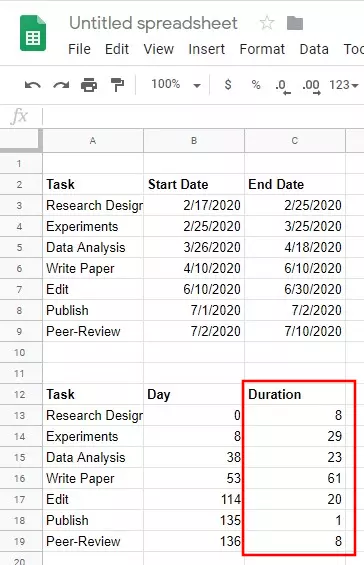
6. Hold down the small blue square in the cell and pull it across the remaining cells. The formula is now being copied across the remainder of the tasks and the duration for each task is automatically calculated.
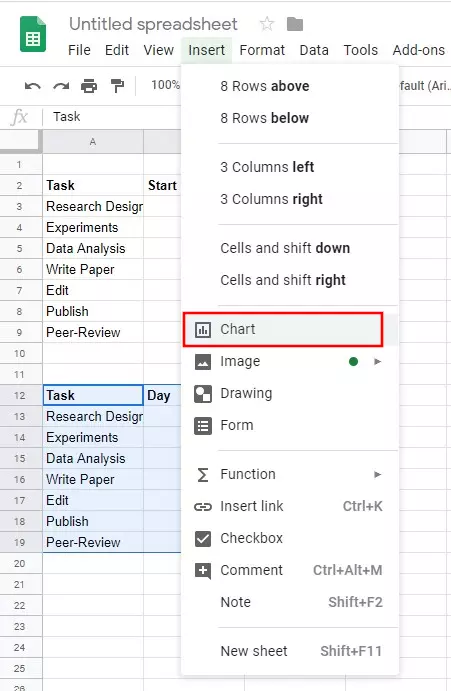
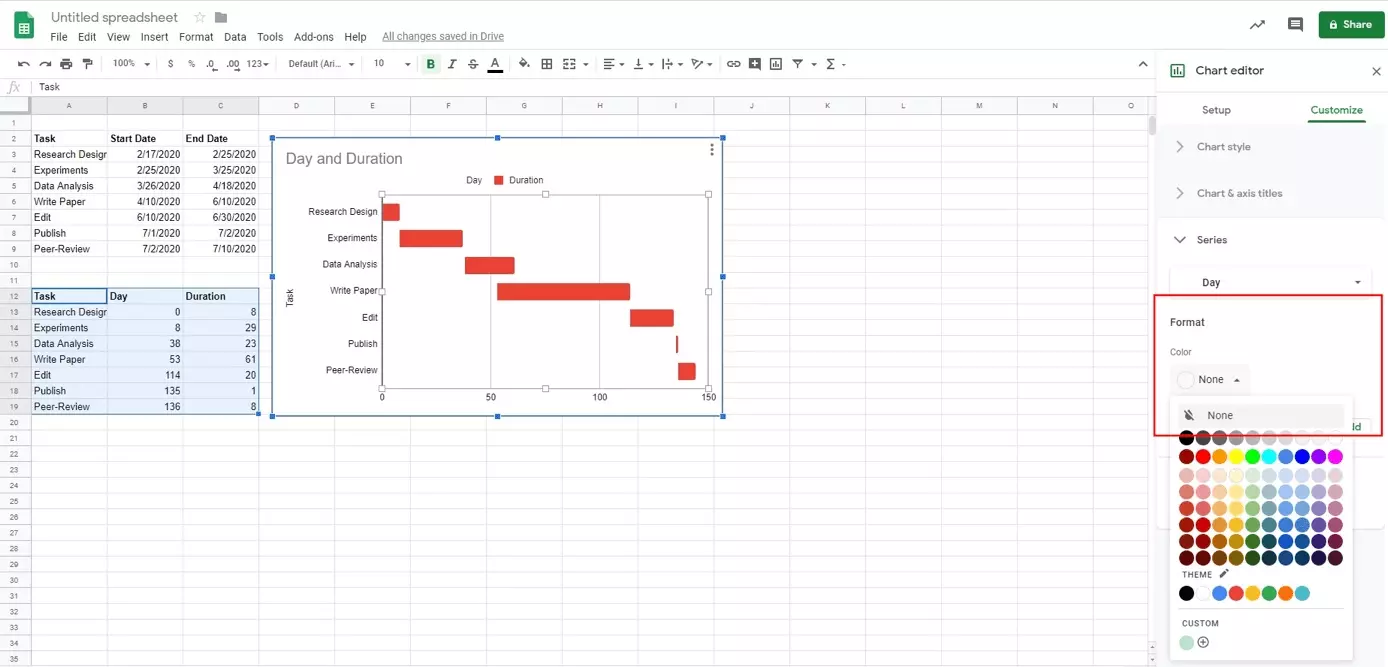
8. On the right side, a chart editor menu will pop up. If this doesn’t open automatically, select the Gantt style from the “Chart style” menu option to create your Google Gantt chart. Click on one of the blue bars to access the chart editor for all bars representing “Start date.” Under “Format,” choose “Color” and “None.”
You can now personalise your Gantt chart and make additional adjustments. For example, you could modify the title of the chart, scale its axes or select different colours for individual bars.
If you prefer to work with Microsoft Office, here’s the good news: Microsoft offers similar options to Google Sheets to create many different types of charts. Simply use Excel to create Gantt charts.
- Up to 50 GB Exchange email account
- Outlook Web App and collaboration tools
- Expert support & setup service


