

How to use the Python Pandas library for data analysis and manipulation

Python Pandas is an open-source library specifically designed for analysing and manipulating data. It provides programmers with data structures and functions that simplify the handling of numerical tables and time series.
Ask, create and research with the European alternative to ChatGPT. Robust security and unlimited chats give you peace of mind.
What is Python Pandas used for?
The Pandas library is widely used in various areas of data processing, thanks to its extensive functions that support a range of applications:
-Exploratory Data Analysis (EDA): Python Pandas facilitates the exploration and general understanding of data sets. With functions such as describe(), head() or info(), developers can quickly gain insights into the data sets and recognise statistical correlations.
- Data cleansing and preprocessing: Data from diverse sources often needs to be cleansed and brought into a consistent format before it can be analysed. Here too, Pandas offers a variety of functions for filtering or transforming data.
- Data manipulation and transformation: The main task of Pandas is the manipulation, analysis, and transformation of data sets. Functions such as merge() or groupby() enable complex data operations.
- Data visualisation: Another practical field of application arises in combination with libraries such as Matplotlib or Seaborn. In this way, Pandas data frames can be converted directly into meaningful diagrams or plotted.
Advantages of Python Pandas
Python Pandas offers numerous advantages that make it an indispensable tool for data analysts and researchers. The intuitive and easy to understand API ensures a high level of user-friendliness. Since the central data structures of Python Pandas – DataFrame und Series– are similar to spreadsheets, getting started is not too difficult either.
Another key advantage of Python Pandas is its performance. Although Python is regarded as a rather slow programming language, Pandas can process even large data sets efficiently. This is because the library is written in C and uses optimised algorithms.
Pandas supports various data formats, including CSV, Excel, and SQL databases, allowing for easy import and export from diverse sources, which adds impressive flexibility. Its integration with existing libraries in the Python ecosystem, such as NumPy or Matplotlib, further enhances its versatility and enables comprehensive data analysis and modelling.
If you’re experienced with other programming languages like R or database languages such as SQL, you’ll find many familiar concepts when working with Pandas.
A practical example of the Pandas syntax
To illustrate the basic syntax of Pandas, let’s look at a simple example. Suppose we have a CSV dataset that contains information about sales. We’ll load this dataset, examine it, and perform some basic data manipulation. The data set is structured as follows:
Date,Product,Quantity,Price
2024-01-01,Product A,10,20.00
2024-01-02,Product B,5,30.00
2024-01-03,Product C,7,25.00
2024-01-04,Product A,3,20.00
2024-01-05,Product B,6,30.00
2024-01-06,Product C,2,25.00
2024-01-07,Product A,8,20.00
2024-01-08,Product B,4,30.00
2024-01-09,Product C,10,25.00
Step 1: Importing pandas and loading the data set
Once Python Pandas has been imported, you can create a dataframe from the CSV data using read_csv().
import pandas as pd
# Load the data record from a CSV file named sales_data.csv
df = pd.read_csv('sales_data.csv')Step 2: Examining the data set
An initial overview of the data can be obtained by displaying the first lines and a statistical summary of the data set. The functions head() and describe() are used for this purpose. The latter provides an overview of important statistical key figures such as the minimum and maximum value, the standard deviation or the mean value.
# Display the first five lines of the data frame
print(df.head())
# Display a statistical summary
print(df.describe())Step 3: Manipulating the data
Data manipulation also works with Python Pandas. In the following code snippet, the sales data is to be aggregated by product and month:
# Convert the ‘Date’ column into a datetime object so that the dates are recognised as such
df['Date'] = pd.to_datetime(df['Date'])
# Extract the month from the ‘Date’ column and save it in a new column called ‘Month’
df['Month'] = df['Date'].dt.month
# Calculate the revenue (Quantity * Price) and save it in the column called ‘Revenue’
df['Revenue'] = df['Quantity'] * df['Price']
# Aggregate sales data by product and month
sales_summary = df.groupby(['Product', 'Month'])['Revenue'].sum().reset_index()
# Display aggregated data
print(sales_summary)Step 4: Visualising the data
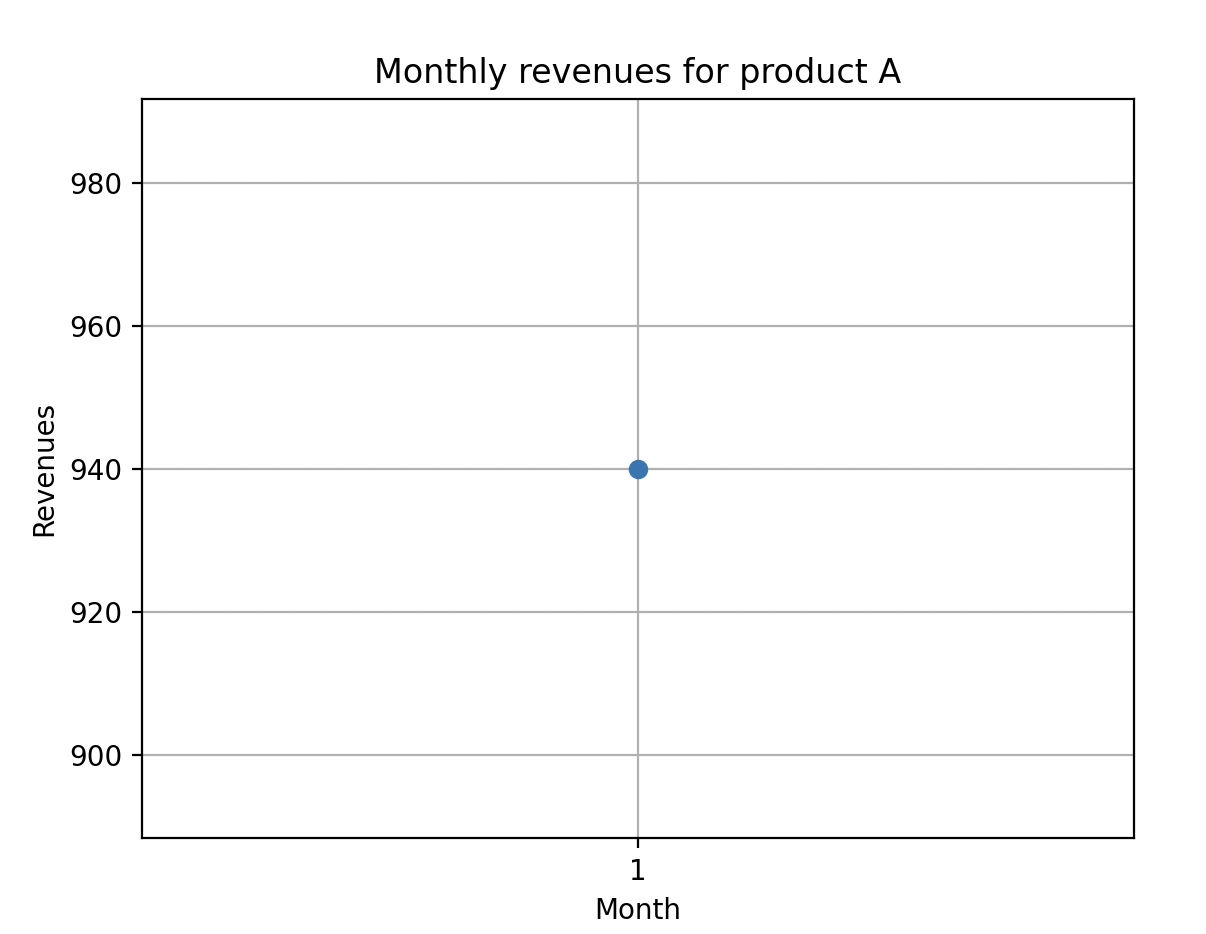
Finally, you can visualise the monthly sales figures of a product using the additional Python library Matplotlib.
import matplotlib.pyplot as plt
# Filter data for a specific product
product_sales = sales_summary[sales_summary['Product'] == 'Product A']
# Create a line diagram
plt.plot(product_sales['Month'], product_sales['Revenue'], marker='o')
plt.xlabel('Month')
plt.gca().set_xticks(product_sales['Month'])
plt.ylabel('Turnover')
plt.title('Monthly turnover for product A')
plt.grid(True)
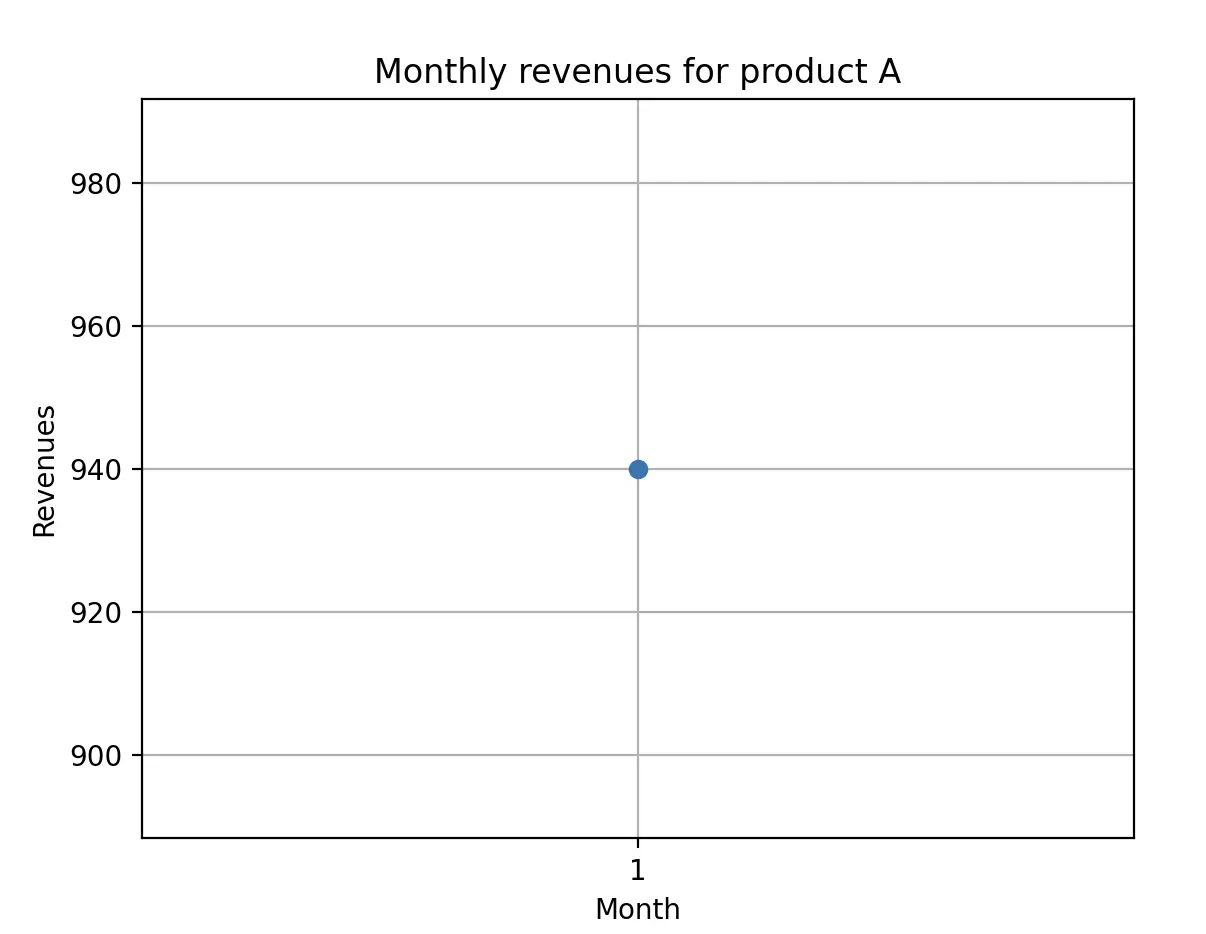
plt.show()The visualised diagram indicates that in the first month of the year, £940 was generated from product A:
Reviewer

Christian Heldmaier
Christian Heldmaier is an experienced online marketing and SEO specialist from Karlsruhe. He has been working as an SEO Manager at IONOS since July 2020.